Lessons from Sports Analytics
Sports Analytics is a window into what People Analytics might look like if we had perfect information. The results: a success, but not perfect
In a perfect world, how would we use data and analytics to improve talent decisions? One way to think about it is to imagine we’re in a world with perfect information:
The win/loss conditions for the performance of the organization are clear
Worker performance is observable and objectively measured
The organization’s competitors have the same goals, follow the same rules, and you can observe their talent too
How would we act if these assumptions were actually met? Would we approach problems differently, or reprioritize our focus on different problems entirely?
Fortunately, this doesn’t have to be a thought experiment - this is the world of sports analytics. If you’re familiar with the Moneyball story, then this connection may not be new to you. However, like the broader data analytics field, sports analytics has had around two decades to mature. I think it’s time to take another look, and see what we can learn and apply in our, admittedly, messier worlds. As a sports fan who works in people analytics, here are my top four takeaways:
Lesson 1: Analytics changes the game
By now, it’s clear that the adoption of analytics by professional teams has led to widespread strategic changes in how they approach the game. Here are two notable examples:
4th down decisions
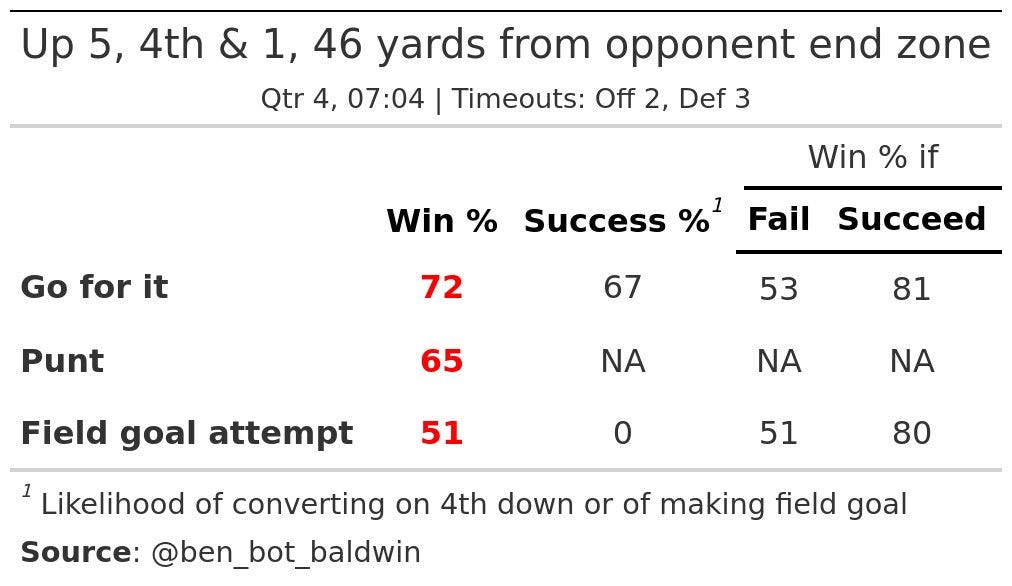
Football coaches frequently face difficult tradeoff decisions on 4th down: should they punt the ball away and play the field position game, kick a field goal to try for 3 points, or should they risk going for it with the hopes of eventually scoring a touchdown?
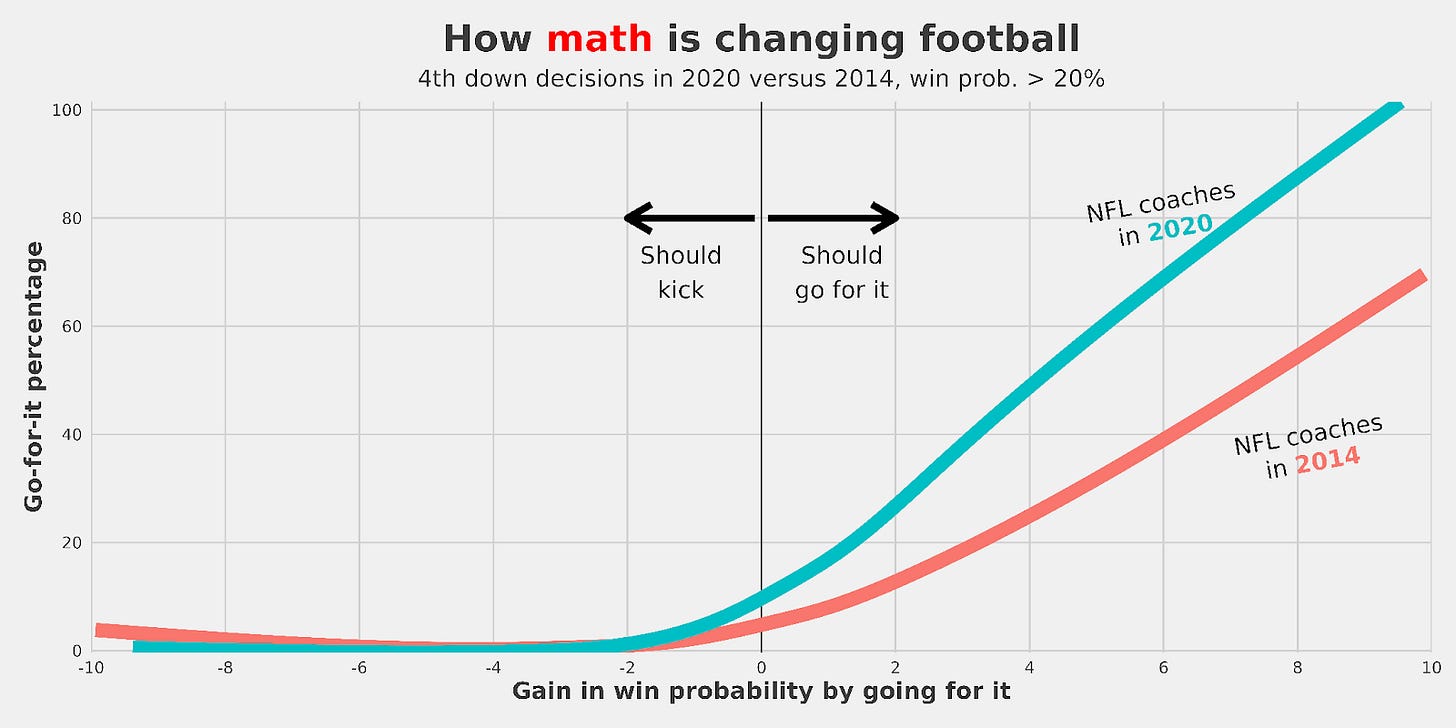
Historically coaches have used a combination of judgement and conventional wisdom to make these choices. But we have a ton of historical data, and this data suggests that coaches have been grossly risk-averse. Using this data, Ben Baldwin, a statistician / economist who writes for the Athletic, created a 4th-down decision model that recommends a decision based on each option’s impact on win probability.
Thanks to data like this, NFL coaches have slowly but surely become less conservative in their decision making, and are starting to take chances that increase the expected value of a win. That said, there is still probably some “win probability” being left on the table - as this graph shows, when teams could gain a 4 percent increase in win probability, they’re still only going for it about 50% of the time.
The three-point revolution
In 2007, the Houston Rockets hired Daryl Morey, who had never played college or professional basketball, to be their general manager. A former consultant and statistician, Morey introduced a more data-driven approach to how NBA teams ran their offense: a focus on the 3-pt shot, and 2pt shots close to the rim as being the most efficient ways to “spend” a possession.
The rockets shot a lot more 3 pointers (it was already common knowledge that 2pt layups are the best shot), and avoided long 2s. This approach maximizes the expected points per shot attempt, but part of the insight is that when you shoot a lot of threes, you also stretch out the defense, making them guard a larger area on the floor, and make them vulnerable to easy layups via rapid ball movement and back-cuts.
Morey’s data-driven approach led to the Rockets having the 2nd-best win percentage in the NBA during his tenure. More broadly though, his approach led to a revolution across the NBA, with teams across the league attempting more and more 3pt shots over time. This is an example of how analytics can create an edge on the competition, but the advantage may be temporary as innovations diffuse across organizations.
Lesson 2: Teams, not just individuals, are a key unit of analysis
4th down decision making and the three point revolution are two examples of something interesting I have noticed about sports analytics: Counterintuitively, in a world of perfect information about performance, many of the most impactful analytics movements have centered on the effectiveness of the overall team, as opposed to individuals.
As another example, youtuber Michael MacKelvie has a great video explaining how USA’s basketball advantage is being eroded - in part thanks to undervalued international talent, but also because USA basketball is just playing really inefficiently. Michael charted several games from the recent FIBA World Cup and showed that team USA, which had a very disappointing performance, didn’t pass the ball as much as other teams.
Specifically, Michael was able to show that the more often teams reverse the ball by passing it to the other side of the court, the more often they’re able to score. Other basketball teams like my Kansas Jayhawks have used similar insights in the past to educate their strategy. While the analysis is simple, this example demonstrates that relevance to the team and actionability for the leader are what make the difference in analytics.
Lesson 3: Cognitive biases mean that talent is often not valued appropriately
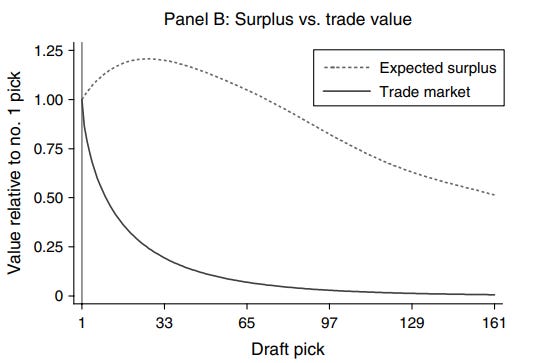
The NFL draft is a perfect microcosm for studying how talent is valued - as Cade Massey and Richard Thaler did in their 2013 study “The Loser’s Curse: Decision Making and Market Efficiency in the National Football League Draft.” Picks in the NFL draft are allocated by teams’ success in the prior season, with the worst team getting the highest pick and the best team receiving the lowest pick. Because teams can trade picks for other picks and/or existing players, this creates a market which we can peer into and extrapolate how picks (and talent) are valued.
Massey and Thaler found that NFL teams consistently overvalue the top picks relative to their historical value in terms of player performance (minus compensation). The researchers argue that this behavior, despite being suboptimal from a performance perspective, is in line with common psychological biases. Take for example the disproportionate attention and focus placed on projected top picks - through name recognition alone (availability bias) we might expect teams to over-index on these top names, and that’s exactly what happens.

Based on this research, Thaler once gave advice to management of the Washington football team. The owner and his associates were excited about the findings, and were receptive to the message: trade their overvalued high pick for multiple lower-round picks with higher surplus value.
Lesson 4: There’s no replacement for data-driven leadership
4th-down decision making is a great example of how, despite analytics’ positive impact, there is opportunity being left on the table in terms of acting on recommendations. Critics will point out that analytics can’t replace leader decision making, because leaders have context and knowledge that is unavailable to statistical models. They are correct, but I would wager that over the long haul, leaders who neglect the data are going to lose to those who allow it to guide their decisions.
Case in point: when draft day came for the Washington football team, they went against Thaler’s recommendation and used their top (ostensibly overvalued) draft pick. When Thaler asked a staffer why, he was told, “Mr. Snyder wanted to win now.”
Washington has had just 5 winning seasons in the last 23 years.


