From Correlation to Causation: Leveling Up People Analytics with Econometrics
Our clients have questions about causal relationships. To drive more impact, it's time for People Analytics to add econometric methods to the toolkit
Impact in People Analytics and Covert Causal Questions
Recently, Cole Napper of Directionally Correct and various colleagues wrote a series of articles talking about the slowing growth of people analytics field. In part two they argue “…at one point people analytics was on the ‘bleeding edge’. We need to return there, and it will take all of us. We must be more than just dashboards.” I strongly agree with this sentiment that we need to be better. The question is, exactly how?
As I’ve argued before, often HR and business leaders have causal questions in mind when they engage with people analytics. Throughout my time in people analytics, I’ve observed many people using HR dashboards containing simple metrics like averages or rates, sliced by demographic variables, and come away with causal interpretations. They didn’t know exactly what to ask for, but they had what I like to call a covert causal question (CCQ) in mind. In this common conundrum, our clients run the risk of making unfounded interpretations of the data, because as we’ll explore in this article, averages lie all the time.
A savvy consultant might spot the CCQ, but may not have the tools to answer it - moving beyond descriptive statistics or correlational studies to causal interpretation in applied settings is difficult. This is where I/O psychologists, who make up a substantial portion of the people analytics field, are trained to reflexively respond with caveats, caution, and “correlation is not causation”. This vigilance is laudable, but I really think this is a major missed opportunity for People Analytics. To drive more impact, we should be playing to win instead of playing not to lose.
In order for People Analytics to level up, we need to become more sophisticated purveyors of causal inference. Fortunately, a revolution has been brewing in econometrics that can help.
Causal Inference on Observational Data: People Analytics, meet ‘Metrics!
The crux of the problem is that randomized experiments, the gold standard for establishing causality, are often impractical or unethical to perform with people in real organizations as subjects. To answer causal questions, we have to perform causal inference techniques on (largely) observational data. Thankfully, there is an emerging playbook for doing this. In 2021, Joshua Angrist and Guido Imbens won the Nobel prize for their methodological contributions to the analysis of causal relationships from observational data. Angrist in particular helped develop these techniques within the labor economics context - that is - applying econometric techniques on observational data to answer causal questions about workers and organizations. Are you seeing the connection yet?
This is a little confusing, but there’s nothing inherently “economics-y” about econometrics. Even economists just refer to it as “metrics”. Here’s what Angrist has to say in the introduction to his textbook “Mostly Harmless Economics”:
The concerns of applied econometrics are not fundamentally different from those of other social sciences or epidemiology. Anyone interested in using data to shape public policy or to promote public health must digest and use statistical results. Anyone interested in drawing useful inferences from data on people can be said to be an applied econometrician.
These techniques, which I’ll introduce below, have culminated in a credibility revolution in economics, and they are beginning to be adopted by researchers in other fields such as epidemiology, public policy evaluation, management, and many more. I’m reminded again of the saying, which is becoming a catch phrase of this blog: “the future is already here – it's just not evenly distributed.”
The Basics: Selection Bias & Omitted Variables Bias
To introduce ‘metrics, I will draw an analogy to the other ‘metrics that I/O psychologists are more familiar with (psychometrics). For the uninitiated, classical test theory is the basis for how we measure psychological traits like personality, intelligence, attitudes, and intentions. According to this foundational theory, the true level of an individual’s psychological trait is equal to our measure of it, plus random error:
Econometrics thinks about modelling causal relationships in a very very similar way. If we look at the “bones” of a randomized experiment for example, we can model the outcome as a function of the treatment, plus error (note, both systematic and random are included here). Here is an example of this in the form of a regression equation:
Random experiments work by ensuring that treatment status is unrelated to other factors (observed and unobserved): if we sample a large enough population, randomizing subjects into the treatment and control groups should be enough to allow for a causal interpretation (similar to knowing the “true score” of some psychological trait for an individual).
Psychometric measures live and die by their validity and reliability. Likewise, in the arena of causal inference on observational data, our chief concerns are eliminating selection bias and omitted variables bias. You can think of these as two different flavors of confounding variables. The distinction is that selection bias confounds who ends up in the treatment group, whereas omitted variables bias reflects outside variables that are related to both the treatment, and the error term. Not including these variables in the model could bias our estimate of the treatment effect.1
Selection bias and omitted variables bias are why averages lie. To demonstrate this with a quick thought exercise, take a look at the following examples and think about how either source of error could lead us to the wrong conclusions:
The Finance department has a lower employee engagement score (72%) than the Marketing department (80%)
Women leave the company voluntarily at a higher rate (18%) than men (12%)
Employees with higher tenure (>5 years) have higher performance ratings (+8%)
Taking the first example, we know there are a plethora of factors that influence employee engagement. If the marketing department has a larger proportion of new hires, then this high engagement score could be reflecting the honeymoon effect. The Finance department could also have more hourly employees, which is related to lower employee engagement. It also could be that people with greater (trait) positive affect are more likely to go into Marketing - an example of selection bias. Failure to control for these variables and others through (at the very least) multivariate regression could lead us to erroneously conclude that Marketing is doing something better than Finance to engage their workforce.
5 Key Tools for Causal Inference, & Resources
If you want to learn how to apply econometric techniques, I would strongly recommend Angrist’s introductory book “Mastering ‘Metrics”, which mirrors the graduate textbook “Mostly Harmless Econometrics”, but is a bit lighter on math. The book gives an amazing introduction to the 5 key ‘metrics tools:
1) Randomized experiments: the ideal scenario, but often not feasible.
2) Multivariate regression and matching techniques: can control for confounding variables, but may not warrant causal interpretations if there are still unobserved omitted variables
And the three key ‘metrics methods for causal inference on observational data:
3) Instrumental variables: taking advantage of some outside variable (an instrument) that mimics randomization. For example, imagine you want to study the causal impact of an in-person job training program on job performance. Proximity to the training center could be used as an instrument that influences training participation, because employees who happen to live closer to the center might be more likely to take the training, but not impact job performance directly.
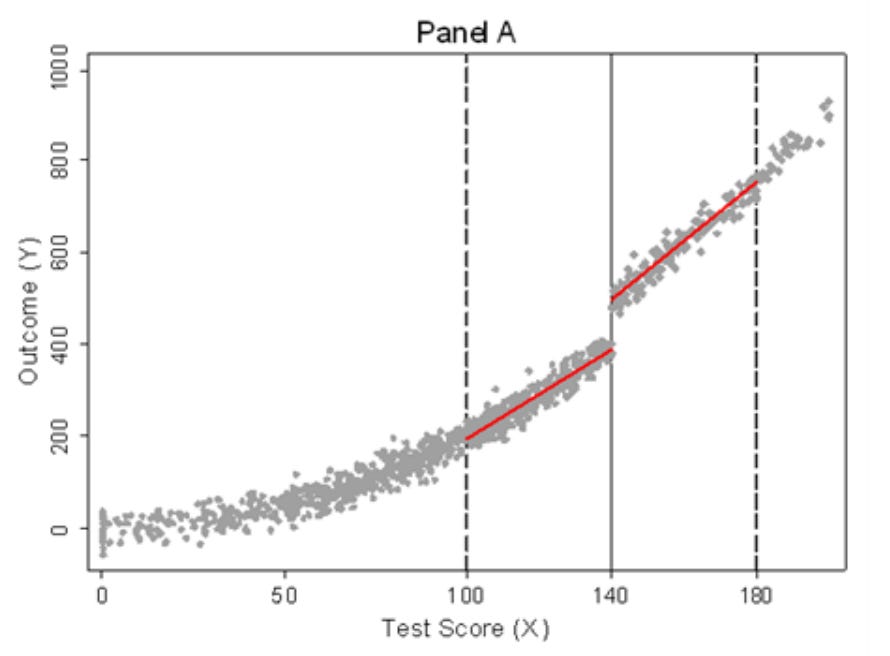
4) Regression discontinuity: taking advantage of arbitrary cutoffs, or events that mimic randomization. For example, if employees need to have 5 years of tenure to receive some benefit, then we can compare outcomes for employees who just missed the cutoff (e.g. 4.9 years tenure) but who are otherwise very similar.

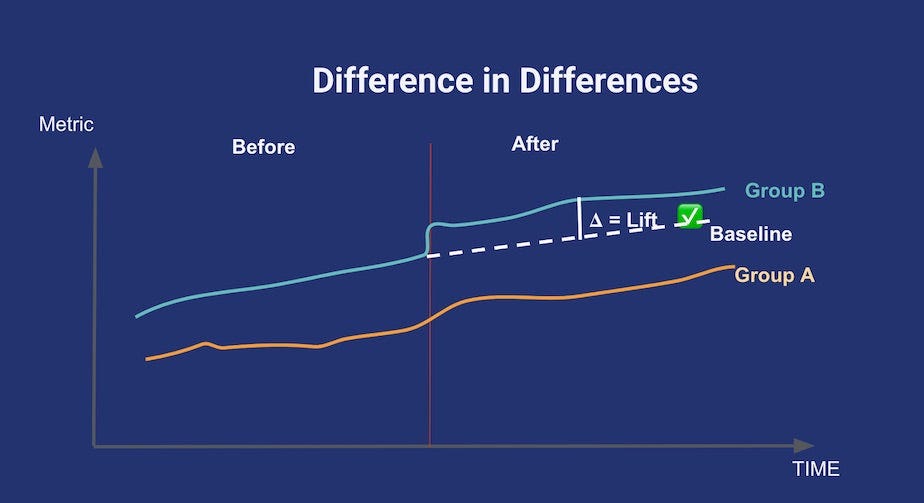
5) Difference-in-differences: allows you to compare differences in outcomes over time between two groups: one that received the treatment and one that did not. The difference between the two trends becomes the estimated causal effect of the treatment. This technique is extremely helpful when you know that there is some underlying trend already. For example, if you want to study the effects of a new TA program on time-to-fill across time, this method would allow you to adjust for other events, programs, or outside factors that are impacting the time-to-fill trend.

Finally, here are some resources you might be interested in to learn more:
My prior article on quasi-experiments in people analytics
Andrew Heiss, a professor of public policy has an amazing online syllabus for his causal inference / program evaluation course
Ben Lambert’s YouTube channel / guide to econometrics
Nick Huntington-Klein’s YouTube channel with tutorials in R
If you’ve ever performed a hierarchical regression analysis, then you’ve seen omitted variables bias in action. If the effect of your independent variable of interest remains stable as you add controls, then you’ve shown a result that is robust.


I totally agree with this Jackson and I love this callout and push for more causal inference approaches. I'm trying to push in this direction in my own work and it has been a mixed bag. So many HR professionals and business leaders (my stakeholders) are used to traditional metrics such as turnover sliced and diced by variables such as tenure, division, job code, gender, etc. I think a key first step is to start to consider other variables that could have a causal relationship which are not the traditional variables that are easy to get because they are more often standard data fields in HR systems. Are you aware of specific case studies or examples in people analytics that demonstrate some of the methods you describe? I think that it would be crucial for the field to show what is possible and get people out of the traditional metrics and analyses.