How big of a talent advantage will remote hiring get you?
It depends on the predictive validity of your hiring methods
Listening to the fraught discourse around hybrid and remote work, it’s clear that organizations have had a tough time weighing the costs and benefits of various arrangements. How many days a week, or per month in-office is optimal? How do we weigh the potential collaboration and innovation benefits of in-person work against the ability to access, and choose from a larger pool of remote talent? These tradeoff decisions must ultimately be value judgements, but ideally they would be data-informed value judgements. That would mean quantifying not just the direction of effects on key outcomes, but the size of them too.
It’s well known that remote job postings yield many more applicants. I couldn’t find good publicly available data on this, but let’s take a directional guess that if a typical location-tied job posting gets 100 completed applications, then a remote job posting yields 200. But for decision makers, the crucial question is whether these additional applications translate into a better chance of hiring a high-performer.
Applying Old Science to a New Problem
Using first-principles thinking, we can imagine a scenario where the selection of a candidate is a truly random, like a coin flip. In this scenario, the extra 100 applications won’t present any increased chance of a better hire. Predictive validity, the degree to which a hiring method predicts future job performance, is key to understanding the upside that a larger pool of applicants offers.
This basic insight was codified back in the 1930s by researchers H.C. Taylor and J.T. Russell in their study The relationship of validity coefficients to the practical effectiveness of tests in selection: discussion and tables. The key contribution of this research was a set formulas (and accompanying reference tables) that can help us estimate the likelihood of hiring successful employees given the quality of the assessment tool and the proportion of applicants selected.
In addition to predictive validity, the researchers emphasized two other key factors that influence our broader question:
Selection Ratio: the percentage of applicants who are actually selected for the job. Note for modern purposes we will assume this is post-screening. For example, if there are 10 qualified applicants and 1 is chosen, the selection ratio is 10%.
Base Rate: This represents the percentage of candidates who would be considered successful at the job if they were chosen at random. So, if historically 60 out of every 100 randomly chosen employees are good at the job, the base rate is 60%.
Simulating Some Scenarios
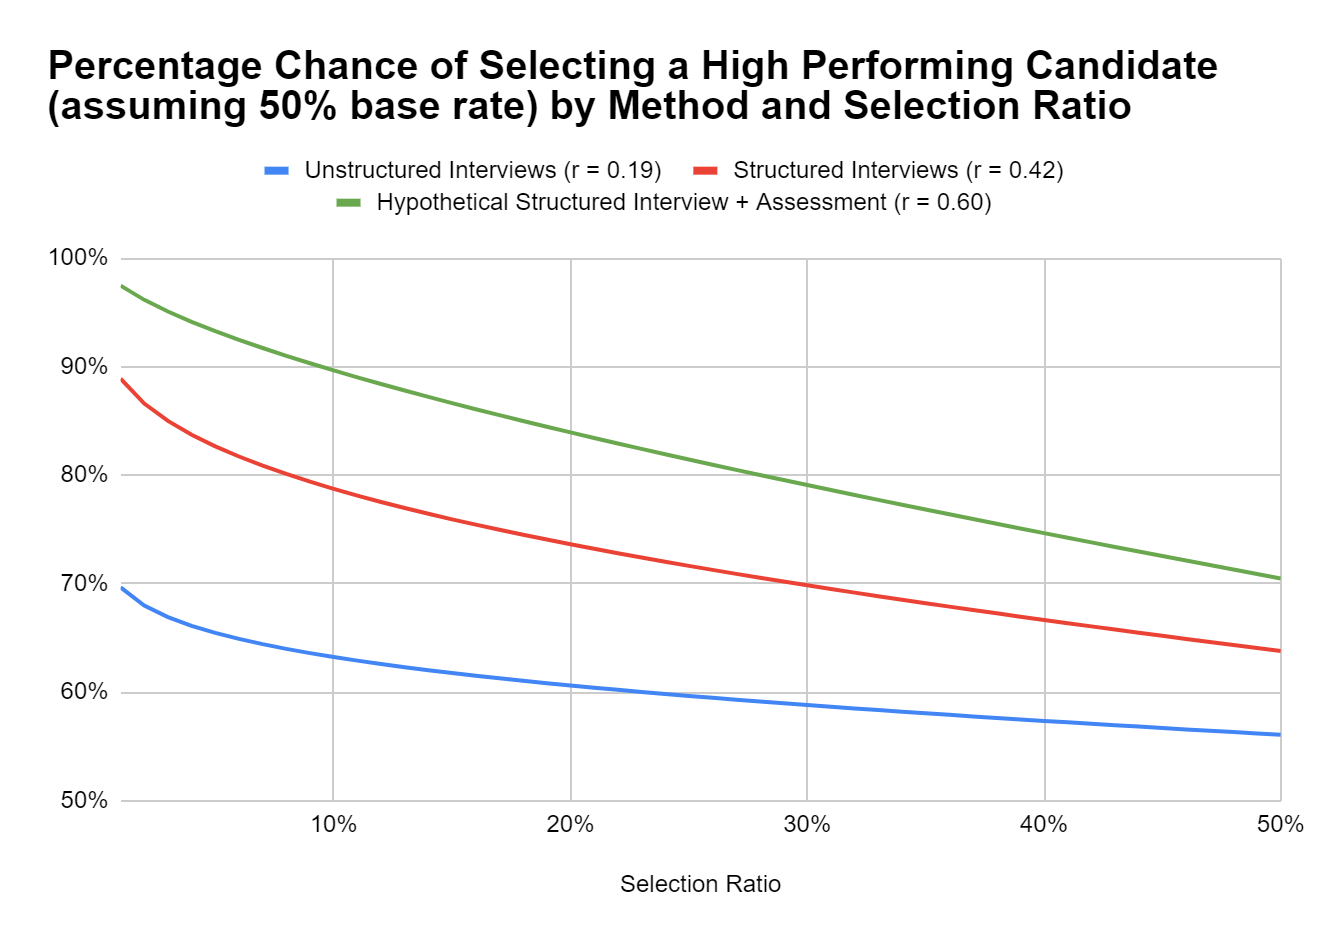
Rather than using the old dusty tables to explore this, there is an R package called TaylorRussell (shout out to Niels Waller who created it) that we can use to run some scenarios. Let’s assume the following: We have a job where 50% of hires are “successful”, and because it’s my pet gripe, let’s compare unstructured vs. structured interviews (using updated validity estimates from (Sackett et al. 2022). For fun, I’ll throw in a hypothetical “Structured Interview + Assessment” to represent an achievable, but high-validity selection procedure.1
The slope of each line represents the increasing chance of hiring a successful candidate as your selection ratio declines. As you can see, they get steeper as the validity of the selection methods increase.
To put this into actionable terms with an example, if you could choose 1 out of 5 qualified candidates for a location-tied role, vs. 1 out of 10 for a remote role, these would be the probabilities of selecting a high performing candidate:

The “remote premiums” here, representing the benefits of being able to be choosier about candidates, might not seem very big. However, it’s important to keep the law of large numbers in mind: for organizations hiring thousands of people every year, a 5% increase in the quality of hires translates to enormous cost-avoidance, not to mention the positive benefits of having more high performers.
Caveats and Conclusions
Admittedly, the lack publicly available data on the number of increased applications for remote postings as well as on organizations’ true selection ratios makes this exploration a purely conceptual one. That said, the core concepts should apply universally - and I would encourage analysts to apply this framework on their organizations’ own data. Hopefully, making insights like this more accessible could notch one small victory in terms of facilitating a more productive, and data-informed conversation about the costs and benefits of various working arrangements.
I will position my answer to the overall strategic question as a prediction that should be further tested empirically: Organizations who use rigorous hiring methods will tend to take advantage of expanded access to talent via remote work, because rigorous hiring methods moderate the relationship between larger applicant pools and increased quality of hire. On the other hand, organizations who haven’t invested in rigorous selection methods may not be incentivized to look beyond their local geographic regions, as the quality-of-hire premium will be low or non-existent.
Code for those interested, adapted from the TaylorRussell package manual:
library(TaylorRussell)

TRDemo()

TR(BR = .6, SR = .1, CV = .1, PrintLevel = 1, Digits = 3)

### producing a custom Taylor Russell table using interview validity coefficients from Sackett et al. (2022)###

r <- c(.19, .42, .60)
sr <- c(.01, seq(.02, .49, by = .01), .50)
num.r <- length(r)
num.sr <- length(sr)
old <- options(width = 132)
Table3 <- matrix(0, num.r, num.sr)

for(i in 1 : num.r){
  for(j in 1:num.sr){
    Table3[i,j] <- TaylorRussell(
      SR = sr[j],
      BR = .50,
      R = matrix(c(1, r[i], r[i], 1), 2, 2),
      PrintLevel = 0,
      Digits = 3)$PPV
  }# END over j
}# END over i

rownames(Table3) <- r
colnames(Table3) <- sr

Table3 |> round(2)

table3 <- as.data.frame(Table3)
write.csv(table3, "selectiontable.csv")


